                NFLX      DIS     AAPL      Dates       date
2012-10-01  8.007143 46.62054 20.12959 2012-10-01 2012-10-01
2012-10-02  8.065714 46.23555 20.18820 2012-10-02 2012-10-02
2012-10-03  8.940000 46.97869 20.49776 2012-10-03 2012-10-03
2012-10-04  9.524286 47.12194 20.35580 2012-10-04 2012-10-04
2012-10-05  9.508571 47.42636 19.92200 2012-10-05 2012-10-05
2012-10-08 10.502857 46.85334 19.48180 2012-10-08 2012-10-08Data Vizes in TS

Elise Rust
ANLY 560
Jan 2023
1. Stock Market Analysis
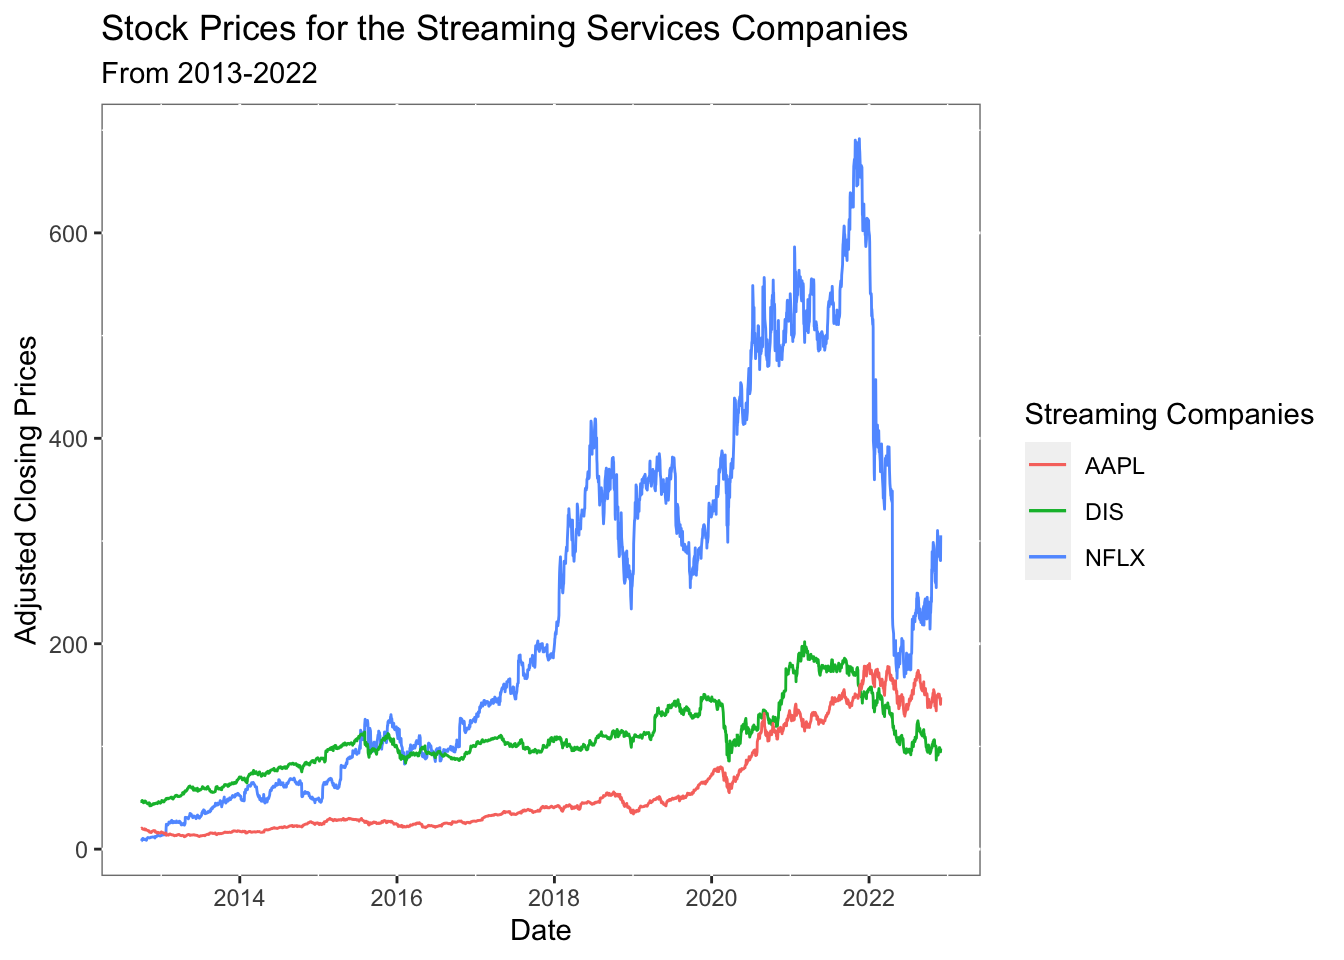
Take three stocks of streaming companies: Netflix (NFLX), Disney (DIS), and Apple (AAPL).
Now add a hover feature to the plot
What does the graph say:
Shown here are the adjusted closing stock prices for three streaming services (Netflix, Disney, and Apple) between 2013 and 2022. Netflix was the original streaming giant, founded in 1997 as the first place a user could stream on-demand shows and movies starting in 2007. While they initially dominated the space, and saw a steady uptick in market value through 2019. Disney and Apple are both larger companies that span markets: Disney has a long history of movie production and amusement parks (Disney World and Disney Land) and entered the streaming space with Disney+ in November 2019. Apple historically produced technology (computers, tablets, phones, etc.) and entered the streaming space with AppleTV in 2007. The rise of these competitors - especially Disney+ who, upon launching, removed all Disney films and content from Netflix for their own platform - has caused Netflix to take a hit in their stock price. This is clearly shown in 2019 when NFLX market cap went from 375 to 265 per share. All three companies took a hit at the beginning of the pandemic in March 2020, but bounced back quickly as lockdown forced the global population inside where many turned to streaming services. Netflix stock peaked at 681 per share in November of 2021, but crashed to 186 per share as they’ve begun to deal with inflation and increased streaming competition.
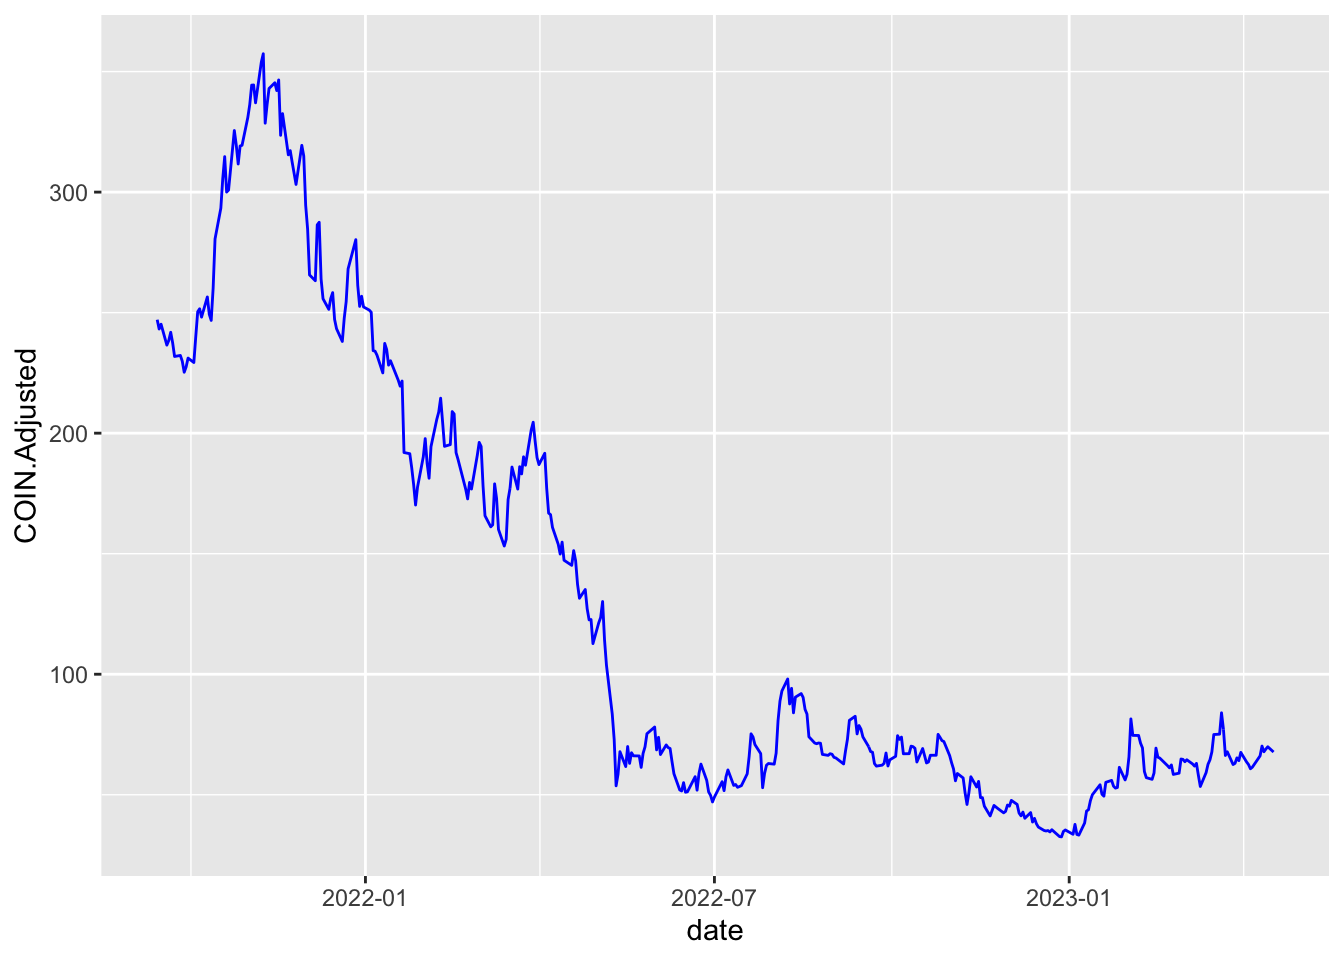
Crypto –> Coinbase Analysis using Plotly
           COIN.Open COIN.High COIN.Low COIN.Close COIN.Volume COIN.Adjusted
2021-09-15    244.00    249.47   242.05     247.07     2148300        247.07
2021-09-16    247.38    247.46   239.61     243.21     2596800        243.21
2021-09-17    243.13    245.63   238.75     245.19     2948000        245.19
2021-09-20    234.45    237.36   231.15     236.53     4192600        236.53
2021-09-21    237.01    240.26   234.26     238.46     2174700        238.46
2021-09-22    239.91    243.20   237.76     241.85     1660200        241.85
GGPlot Plot
Plotly Plot
What does the graph say:
Cryptocurrency, including Coinbase ($COIN), has suffered a devastating drop in confidence and value throughout 2022. Market value peaked for COIN in November of 2021, at around 350 per share, before seeing a precipitious drop to just 53.72 by May of 2022. Since then, it has hovered around this lower price per share, with very few indications of gaining value in the near future. 2022 has been widely deemed the beginning of “crypto winter” as a number of high profile companies, including Coinbase, Bitcoin, and terraUSD, saw their market value drop by up to 70%. Many people have attributed this to a pessimistic global macro outlook when the US Fed hiked interest rates and investors pivoted from risky assets like crypto to safer assets.
2. Plot the climate data (climate.csv) using Plotly
The original climate dataframe looks like so:
      STATION                      NAME       DATE DAPR MDPR PRCP SNOW SNWD
1 US1DCDC0009 WASHINGTON 2.0 SSW, DC US 2021-03-06   NA   NA    0    0   NA
2 US1DCDC0009 WASHINGTON 2.0 SSW, DC US 2021-03-07   NA   NA    0    0   NA
3 US1DCDC0009 WASHINGTON 2.0 SSW, DC US 2021-03-08   NA   NA    0    0   NA
4 US1DCDC0009 WASHINGTON 2.0 SSW, DC US 2021-03-09   NA   NA    0    0   NA
5 US1DCDC0009 WASHINGTON 2.0 SSW, DC US 2021-03-10   NA   NA    0    0   NA
6 US1DCDC0009 WASHINGTON 2.0 SSW, DC US 2021-03-11   NA   NA    0    0   NA
  TMAX TMIN TOBS WESD
1   NA   NA   NA   NA
2   NA   NA   NA   NA
3   NA   NA   NA   NA
4   NA   NA   NA   NA
5   NA   NA   NA   NA
6   NA   NA   NA   NA
Data Cleaning and Transformation
After data cleaning and transformation, we will look at Monthly Precipitation Totals across the different stations. The transformed dataframe looks like:
# A tibble: 12 × 8
   Month Dalecarlia_Reservoir National_Arboretum   DC1   DC2 DC2.6 DC3.1 DC5.1
   <chr>                <dbl>              <dbl> <dbl> <dbl> <dbl> <dbl> <dbl>
 1 01                    2.19               1.78  0.29  0     1.48  0.31  1.26
 2 02                    3.04               4.28  3.32  0     2.55  3.06  4.04
 3 03                    2.61               3.66  2.45  0.45  0.01  3.15  2.53
 4 04                    3.67               3.19  1.19  1.76  2.22  2.97  3.66
 5 05                    3.44               3.75  1.02  4.03  2.3   3     2.88
 6 06                    3.04               4.37  4.02  4.72  4.14  1.88  8.03
 7 07                    3.99               5.33  3.14  0     3.93  4.33  4.03
 8 08                    9.06               6.76  8.27  0     6.52  7.81 13.4
 9 09                    7.67               3.36  2.13  0.12  3.95  4.05  9.24
10 10                    0                  0     2.12  3.32  4.19  3.94  5.86
11 11                    0                  0     0.73  0.93  0.37  1.13  1.62
12 12                    0                  0     0.42  0.3   0.67  0.67  0.91
Plot using Plotly
- Daily Precipitation Totals
What the graph is saying:
Seven (7) different monitoring stations across the DC-Maryland-Virginia area have collected precipitation data periodically throughout 2021. Six of the locations are in DC, while Dalecarlia Reservoir is in Bethesda Maryland. The precipitation totals have been plotted by location between January 2021 and January 2022. DC 5.1 NW is the location with the highest precipitation totals, seeing highs in September 2021 (2.12 inches in a day) and October 2021 (over 2 inches multiple days). DC 2 and 2.6 had the lowest precipitation totals, rarely cresting 1 inch of rain any day of the year. The graph does indicate that most of the wards of DC do receive similar rainfall totals, which intuitively makes sense given the small geographic area of the sample. It is notable to see that Ward 5 has higher rainfall, though, so that people living in the area can better prepare for incoming storms.
- Monthly Totals
What the graph is saying:
The same data as above is being examined, but this time precipitation totals were grouped by month so see cumulative effects. Similar trends are shown - notably, that Ward 5 has higher rainfall than surrounding areas, expecially in August - October, so residents should be prepared for incoming storms. On the whole, each location averages about 3-4 inches of rain per month, with Aug-Oct being the highest rainfall months and Nov-Dec being some of the driest months.